Dinosaur detective stories

“Being a paleontologist is like being a coroner except all the witnesses are dead and all the evidence has been left out in the rain for 65 million years” Mike Brett-Surman, 1994

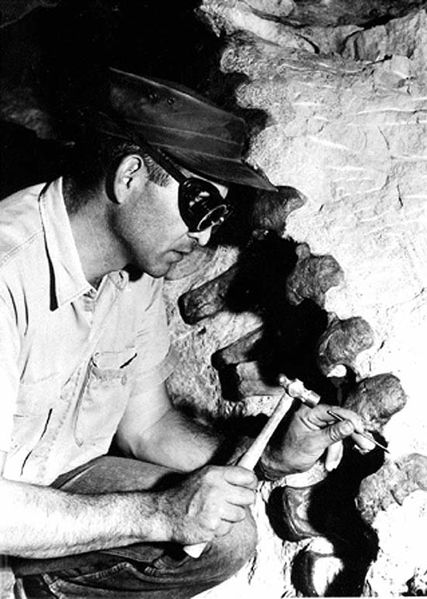
I am very much for palaeontology and the enthusiasm for the science today but there was a time when even the mighty dinosaurs were out of fashion. During the 40s and 50s they were thought of as animals who had been destined for extinction, little more than children’s monsters.

Perish the thought. That changed in both academic and public circles when palaeontologist John Ostrom and his student Bob Bakker came on the scene during the 60s and 70s. The trigger of this ‘dinosaur renaissance’ was Ostrom’s description of Deinonychus which he deemed a fleet footed, endothermic, bird-like animal. This was a world apart from the view of dinosaurs as cold-blooded, tail dragging, sluggards. In Bakker’s book, the Dinosaur Heresies, he presented a persuasive body of evidence to support the idea that dinosaurs were endothermic. Bakker is a great artist too and it really helped to get his point across. You can see his influence in the similarity of the Velociraptors of Jurassic Park infamy to his artwork. This was all very exciting. Now we had animals seemingly on a physiological par with mammals and birds. What I find so impressive is that we can still make inferences about the physiology of long extinct animals so long as we marshal enough evidence.

But the case for endothermy wasn’t so clear cut. The bones of reptiles and amphibians, which are demonstrable ectotherms, show seasonal bone growth and we can see similar patterns in the fossils of dinosaurs. An impasse presented itself.

Until now anyway. The issue, it seems, is that we weren’t looking in the right place. A recent paper in Nature shows why. The authors of the study looked at the histology of modern ruminant mammals revealing that they also display seasonal bone growth and that this can be extended to all endotherms with a constant body temperature. So seasonal bone growth can no longer used as an argument for cold blooded dinosaurs. I think it’s interesting that all it took was for someone to look at modern mammals.

Author

Adam Kane: kanead[at]tcd.ie

Photo credit

wikimedia commons
The not so black and white story of why the zebra got its stripes

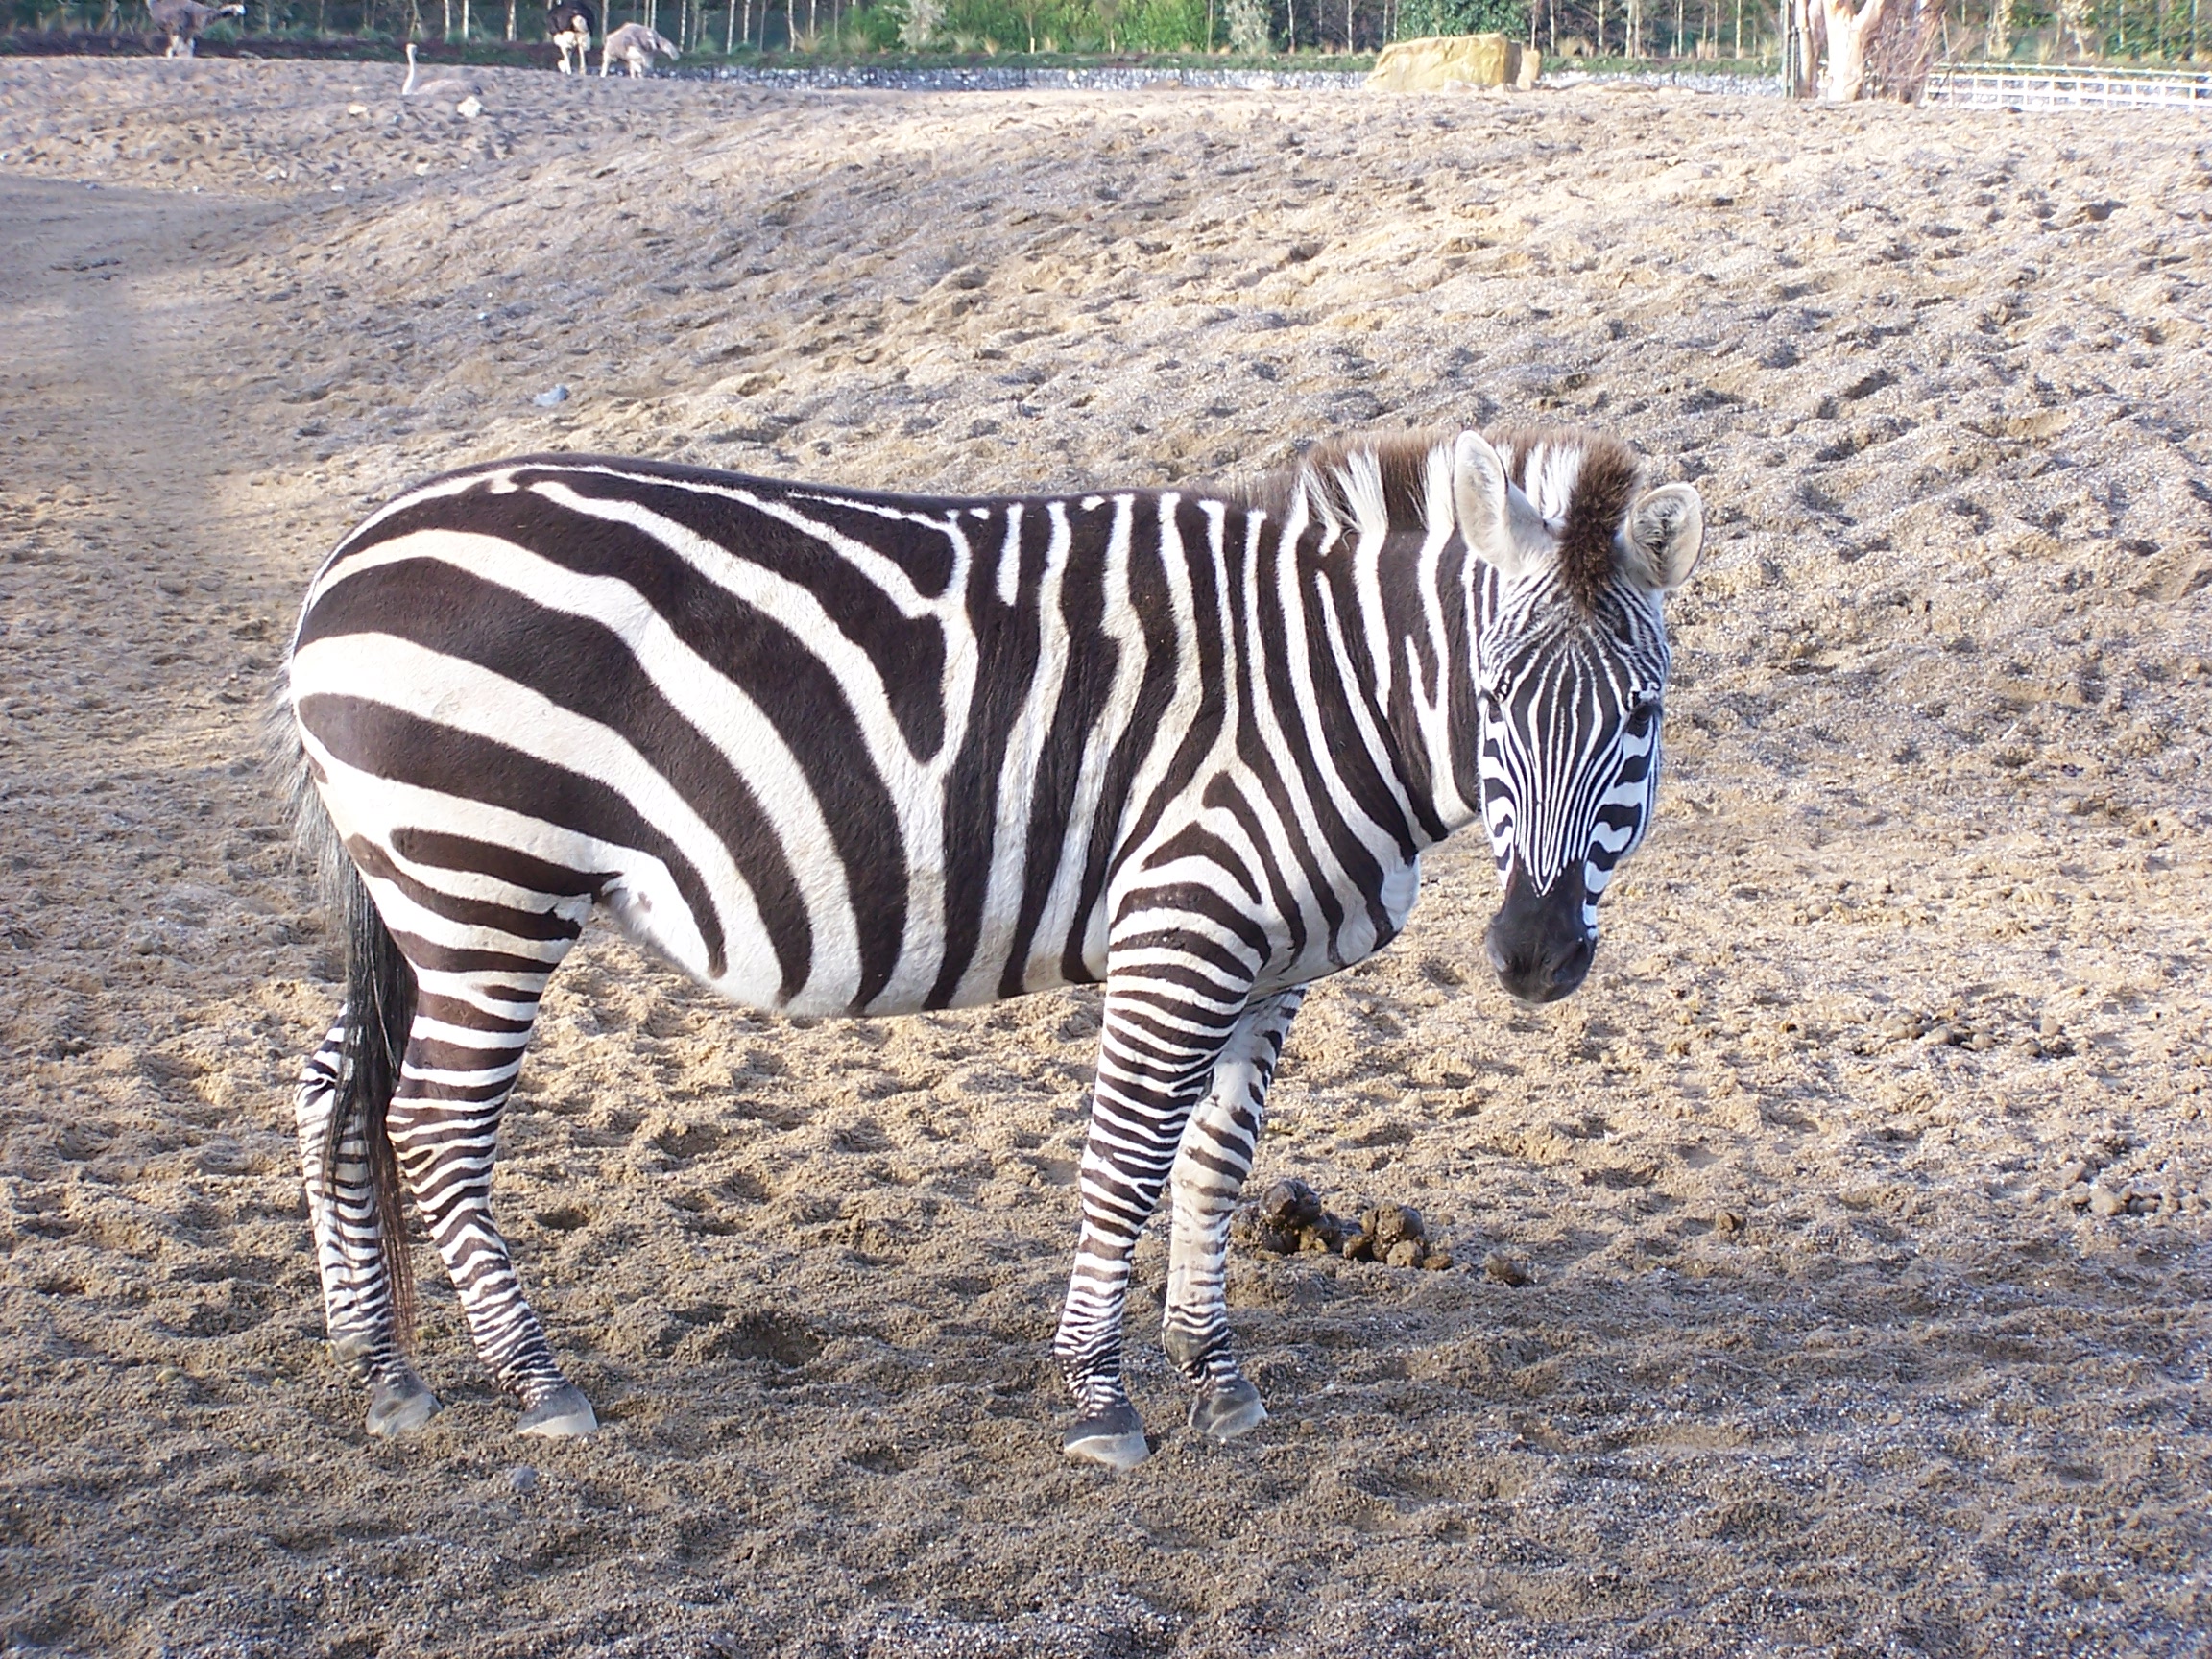
Why are zebra black and white? I would hazard a guess your answer is camouflage, and you would be right… well, mostly. I would then bet you got the beast from which the zebra is hiding wrong. While the black and white stripes might disrupt outline of a zebra in the eyes of an ambushing lion or sprinting cheetah, the scientific evidence points to a much smaller blood thirsty devourer of zebra.

Since the 1970s, experiments have shown that Tsetse flies are less attracted to black and white striped patterns than plain black, white or grey colours. Most recently, a series of experiments conclusively showed that another group of flies, the horseflies, are far less attracted to zebra-stripe patterns than plain, black, white, brown or grey surfaces. Furthermore, narrow bands of stripes are even more effective at keeping hidden from the horseflies, and it’s perhaps no surprise that the legs and heads of zebra contain the closest spaced stripes where blood vessels lie perilously close to the skin surface of these key anatomical locations. The legs being needed to flee from the lions and the head for thinking.

Of course, there may be other factors that simultaneously favour such a striking colour pattern. Regardless though, some interesting evolutionary points follow the “camouflage from flies” idea. Chief among them being: if stripes are so good at hiding from horseflies, then why do Eurasian horses not possess the same pattern where horseflies are also common and a nuisance?

So while the “why” of the zebras stripes seems to have some scientific evidence at last, the “how” they got their stripes is another blog topic for another day and involves leopards, cells, computers and a bit of maths.

Author

Andrew Jackson: a.jackson@tcd.ie

Photo credit

Andrew Jackson

All the better to see you with

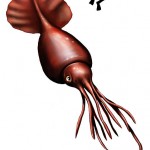
A recent discovery of a large eye found by a beachcomber in Florida initiated a flurry of internet speculation of its mysterious owner. The contenders for ownership included colossal squid, thresher sharks and a range of mysterious sea creatures both real and imagined.

While the owner of the tennis ball sized eye has recently been attributed to a swordfish, it is perhaps not unreasonable to attribute such a large eye to creatures of monstrous sizes, especially considering the eye rivals the size of those of the largest animals to every exist, the cetaceans.

So why don’t we always find the largest eyes in the largest creatures? Moreover, why are the largest eyes found in such an unusual and evolutionarily distant set of creatures including colossal squid, the extinct ichthyosaurs and to a lesser extent swordfish?

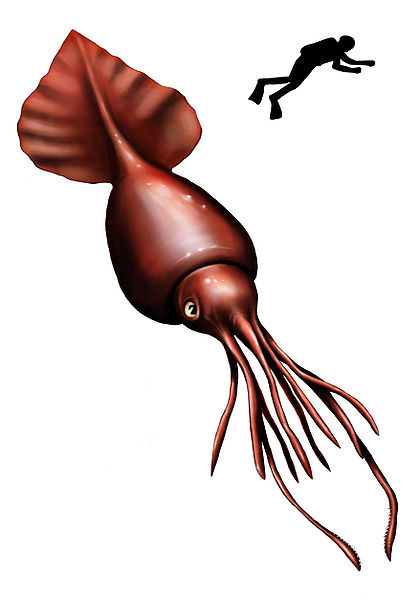
One study recently published in Current Biology has tried to address this mystery by looking at the football sized eyes of the Colossal squid. The eyes of Giant and Colossal squid are the largest of any extant animal with an eye diameter up to three times larger then the next largest eyes, that of swordfish and whales, hence dwarfing the eye found on the beach.

Nilsson et al used model simulation comparing the benefits arising from increasing eye size in relation to spotting point light sources, dark objects against a light background (diurnal vision) and luminescent objects against dark background. They found that in bright-lit areas the benefits arising from larger eyes diminish greatly meaning that whale eyes size represents the limit in terms of visual ability in these environments. However in cases where large luminous objects are against a dark background, extremely large eyes become beneficial again.

Such scenarios of bright objects against a dark background are found in the deepest parts of the oceans where various bioluminescent organisms live. Movement through such waters can disturb such organisms, in particular bacteria, which cause them to create a glowing silhouette of the animal. This is where the advantage arise for the squids large eyes as they can detect the disturbance of its main predator the sperm whale from over 120 meters away, allowing it to take evasive action.

This technique only seems to be advantageous for spotting large predators, which explains why colossal squid and also perhaps why ichthyosaurs had such large eyes, with large pliosaurs their potential predator.

Author

Kevin Healy: healyke@tcd.ie

Photocredit

wikimedia commons

The tree on the web

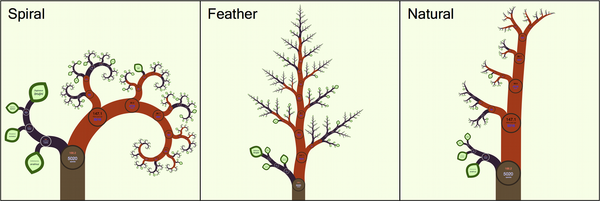
Visualising the tree of life is a challenge for even the most artistically attuned in the scientific community. The problem is the sheer number of species that we need to represent, literally millions. But I think the latest attempt meets the challenge. The developers of OneZoom, the name of the new approach, argue that we need to escape the “paper paradigm”. We should instead make full use of the benefits that digital interactive displays grant us. Worrying that our efforts won’t translate to the printed page is an exercise in Luddism.

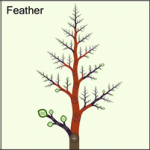
So, why is OneZoom so successful? The display takes its cues from Google Earth, the virtual globe, but whereas in Google Earth you move from continents to countries in OneZoom you zoom in from class to species. It’s even better than that because the whole tree has a fractal geometry, the self similar patterns you can see with real trees, which allows for an intuitive zoom function. One critique is that the fractal geometry ends up displaying the groups that diverged earlier (e.g. monotremes) as larger than the more recent groups (e.g. placentals), suggesting some significance when there is none. So far only the mammals are on show but it’s early days yet.

There are a number of other really useful features like the ability to play the evolution of the whole tree backwards and forwards in time so you can see exactly when a given species, genus or what have you, diverged. The potential for science communication as well as research is great. But enough of me talking about what is best seen and check it out for yourself. The details of OneZoom are available in PLOS Biology.

Author

Adam Kane: kanead[at]tcd.ie

Photo Credit

Rosindell J, Harmon LJ (2012) OneZoom: A Fractal Explorer for the Tree of Life. PLoS Biol 10(10): e1001406. doi:10.1371/journal.pbio.1001406

What did what to what? Finding causality in chaos.

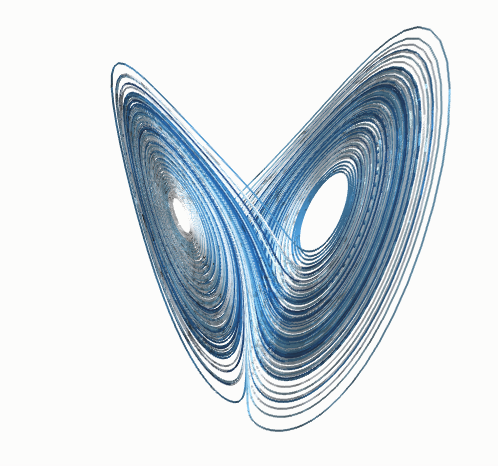
A new paper has been published in Science by George Sugihara and colleagues, which is an immediate contender for the most insightful paper I’ve ever read. In the paper they outline a new method, which they dub ‘Convergent Cross Mapping’ (CCM), for detecting causality between variables using time series data. Not only does CCM allow for the detection of causality but also its directionality. The method takes us well beyond the previous confines of Granger causality (which requires the assumption that systems are linear, or are showing linear behaviour near an equilibrium), and allows us to tease out causality in systems that show non-linearity and chaos. As examples of possible applications of their method the authors address two classic causality problems:

Predator-prey dynamics of Didinium and Paramecium. The authors show that there is bidirectional causality in this classic predator-prey system, but that top-down control is stronger than bottom up control (i.e. Didinium has a larger effect on the Paramecium population than vice-versa).

Dynamics of Pacific sardines and anchovies. There has been a long-standing debate about the cause of alternating dominance between sardines and anchovies in the Pacific. Some arguing that competition between the species is the driver, while others claim the pattern is caused by differing responses to temperature. The authors weigh in on this debate by showing that, while sardine and anchovy abundance is negatively correlated, this is a mirage as there is no causation in either direction. The authors also unambiguously show that sea surface temperature does causally affect the abundance of both species, indicating that climate is the main driver.

I think this method will be absolutely invaluable to future studies, and for me has already proved its worth from the results the authors present. The videos below are from the supplementary information of the paper and explain the method simply using beautiful illustrations.

watch?v=7ucgQE3SO0o

watch?v=NrFdIz-D2yM

watch?v=rs3gYeZeJcw

Author

Luke McNally: mcnall[at]tcd.ie

Photocredit

Wikimedia commons


“To expect the unexpected shows a thoroughly modern intellect”

I spoke before of how to use mathematics to convey an idea in biology. Here, I’ll take a different tack and discuss a paper in which the author makes his argument with naked English. The author in question is Nicholas Humphrey who in his famous paper ‘The social function of the intellect’ draws a wonderful metaphor of Mother Nature as an economist,

“It is not her habit to tolerate needless extravagance in the animals on her production lines: superfluous capacity is trimmed back, new capacity added only as and when it is needed”.

His metaphor serves as an introduction to the puzzle of the seemingly unnecessarily inflated intellects of some animals, notably humans.

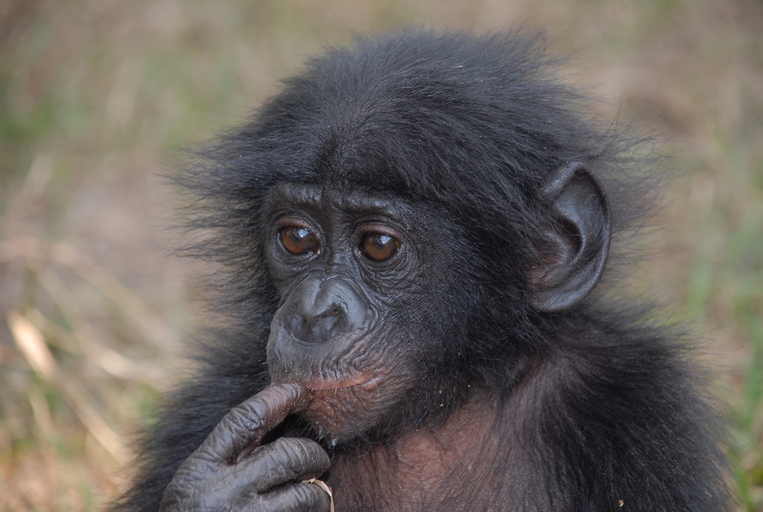
Humphrey questions if such a highly developed intellect is really necessary for invention. The ability to produce tools is generally not a result of deductive reasoning or creative thought but rather follows from aping other individuals or pure trial and error learning. The intellect must have some other function in his estimation and in the end, he proposes that it is as a social glue. The complex interactions that arise out of the social milieu require some serious intellectual horsepower,

“[S]ocial primates are required by the very nature of the system they create and maintain to be calculating beings; they must be able to calculate the consequences of their own behaviour, to calculate the likely behaviour of others, to calculate the balance of advantage and loss – and all this in a context where the evidence on which their calculations are based is ephemeral, ambiguous and liable to change, not least as a consequence of their own actions.”
 

Calculating the consequences of your own behaviour is one thing but understanding that others around you have motivations of their own is a huge leap in understanding. All of this is done without ever having direct access to the subjective thoughts, motives, and desires of another person. Understanding the reasons for understanding is even more impressive and Humphrey’s paper has rightly influenced the theories of scientists since its publication. Most recently a study in the school that mechanistically linked sociality and selection for intelligence.

Author

Adam Kane: kanead[at]tcd.ie

Photo credit

Wikimedia commons

Thunder lizards + methane = climate change

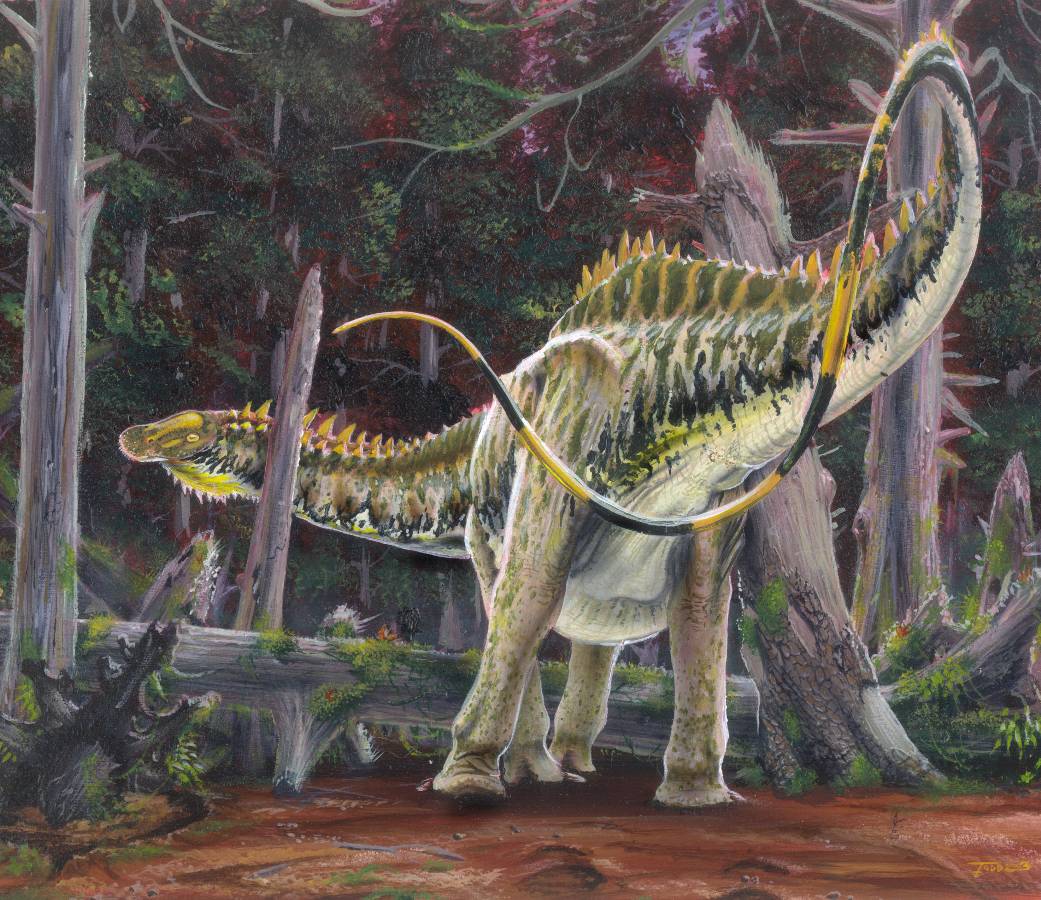
Mathematics is the language of science and when it comes to biology this is no exception. It’s only when you start researching for yourself that you realise how useful a skill it is. Consider, for example, the mathematical approach that Graeme Ruxton and collaborators bring to their research in ecology and evolution. Ruxton has addressed questions ranging from the foraging radius of vultures to a hypothesis proposing that sauropod dinosaurs produced enough methane, a la modern cows, to affect the climate of the time. The latter paper does seem to ask an intractable question on first inspection given that the animals have been extinct for at least 65 million years. So how do the authors even begin to tackle their question?

Mathematically of course. To begin, they estimate the population density of sauropods during the Jurassic Period from fossil data. Then they take a medium sized sauropod like Apatosaurus louise, which weighed around 20,000kg, as a representative animal. Finally they apply a relationship which gives an indication of methane production per animal, while being careful to note the relatively shorter Mesozoic day:

Methane (litres per day) = 0.18 (body mass in kg) 0.97

Multiplying it all out and the bottom line is that these beasts could put out 520 million tonnes of methane per year into the atmosphere. Incredibly, this is comparable to modern day emissions when the effects of this are apparent to all.The upshot the authors draw is that sauropods were drivers of climate change during the Mesozoic Era. There are some uncertainties in the paper to be sure. For one, the metabolism of dinosaurs is still an unknown and this has implications for their output. But the argument seems to be a sound one and this was all achieved with some fairly basic maths.

References

1. Ruxton, GD, Houston, DC (2002). Modelling the energy budget of a colonial bird of prey, the Ruppell’s griffon vulture, and consequences for its breeding ecology. African Journal of Ecology. 40 (3) p. 260–266.

2. Wilkinson DM, Nisbet EG, Ruxton GD (2012) Could methane produced by sauropod dinosaurs have helped drive Mesozoic climate warmth? Current Biology 22: R292-R293. DOI: http://www.cell.com/current-biology/retrieve/pii/S0960982212003296

Author

Adam Kane: kanead[at]tcd.ie

Photo credit

Todd Marshall


Hot heads lead to hot flashes: the evolution of menopause

A new study has been published online in Ecology Letters by Mirkka Lahdenperä and colleagues, which suggests that competition between grandmothers and their daughters-in-law may explain the evolution of menopause. The study used a 200-year dataset of births, deaths and residency patterns in pre-industrial Finland to show that competition between unrelated females of different generations was a key component of selection for menopause.

Humans are among only four species known to lose their ability to reproduce long before they die; the others being killer whales, pilot whales and one aphid species. This phenomenon of menopause poses somewhat of an evolutionary conundrum: how could the loss of the ability to reproduce increase an individual’s fitness?

One possible answer was suggested by Cant & Johnstone, based on differences in how related a mother and daughter-in-law are to each other’s offspring. Historically, females of reproductive age usually leave their family to co-habit with their spouse’s family in most human societies, while males stay near their parents. This means that elder females are typically unrelated to next generation of reproductive females in their locale. Thus, it is expected that young females should invest in competition with their mother-in-law, while the elder mothers-in-law may be selected to cease investing in reproduction and instead invest in helping to raise their related grandchildren.

The new study by Lahdenperä et al. showed that when a mother and daughter-in-law reproduce at the same time offspring survivorship is reduced by up to 66%, while simultaneous reproduction by a mother and daughter had no effect. These patterns suggest that a daughter and mother-in-law compete strongly for resources for their children, as predicted by Cant & Johnstone.

The authors also used their data to parameterise a kin selection model to show that selection should favour menopause around the age of 50 in order to reduce this conflict. This study provides an excellent example of how theory and data can be combined to tackle evolutionary problems, and provides insight into one of the great peculiarities of the human species.

References

1. Lahdenperä M, Gillespie DOS, Lummaa V, Russell AF (2012) Severe intergenerational reproductive conflict and the evolution of menopause. Ecology Letters. (http://onlinelibrary.wiley.com/doi/10.1111/j.1461-0248.2012.01851.x/abstract)

2. Uematsu K, Kutsukake M, Fukatsu T, Shimada M, Shibao H (2010) Altruistic colony defense by menopausal female insects. Current Biology 20: 1182-1186. (http://www.sciencedirect.com/science/article/pii/S0960982210006391)

3. Cant MA, Johnstone RA (2008) Reproductive conflict and the separation of reproductive generations in humans. Proceedings of the National Academy of Sciences 105: 5332-5336. (http://www.pnas.org/content/105/14/5332)

4. http://en.wikipedia.org/wiki/Kin_selection

Author

Luke McNally: mcnalll[at]tcd.ie

Photo credit

Wikimedia Commons